
Bitcoin Price Prediction as BTC Bounces from Recent Bottom – Is a Trend Reversal Near?
Bitcoin, the flagship cryptocurrency, seems to be showing signs of resilience. After its recent price plummet, BTC has managed to bounce off from its bottom, trading today at $26,919 – a slight uptick of 0.53% in the last 24 hours.
This brings the overall live market cap of Bitcoin to a robust $525.29 billion. Current data from CoinMarketCap places Bitcoin unchallenged at its #1 position.
With a circulating supply of approximately 19.51 million BTC coins out of the maximum cap of 21 million, Bitcoin’s current resilience is evident. However, is this the first sign of an impending trend reversal?
Bitcoin Price
Diving into the daily technical outlook of Bitcoin for October 14, based on a 4-hour chart timeframe, a central pivot point is identified at $26,400.
On the brighter side, Bitcoin could challenge the immediate resistance pegged at $28,000. Beyond that, there are two more resistance levels to watch out for: $29,062 and $30,574.
Conversely, Bitcoin can find its support at $25,426, and if this floor breaks, the subsequent supports stand at $23,891 and $22,876, respectively.
When analyzing technical indicators, the Relative Strength Index (RSI) is pegged at 45, suggesting a bearish sentiment below the mid-point of 50. Another critical indicator, the 50-day Exponential Moving Average (EMA), is placed at $27,200.
Since Bitcoin’s current trading price is beneath this marker, it indicates a short-term bearish trend. The Moving Average Convergence Divergence (MACD) data isn’t provided in the request, but it serves as an essential tool to identify momentum shifts in the market.
An interesting pattern identified in recent charts is a double-bottom breakout at $26,900.
Currently, this very level is acting as a resistance for Bitcoin. Historically, such patterns often suggest a possibility of bullish momentum if the resistance is breached.
In conclusion, Bitcoin’s overall trend leans bearish if it trades below the $27,200 mark. However, should it surge past this level, the sentiment could change in favour of the bulls.
Market analysts predict that Bitcoin may challenge the immediate resistance levels in the short term, especially the $28,000 mark.
Bitcoin Price Prediction
In terms of the 4-hour chart, the pivot point for Bitcoin (BTCUSD) is identified at $26,536. On the upside, Bitcoin confronts its first line of resistance at $28,000, followed by resistances at $29,062 and $30,574.
On the downside, support is placed firmly at $25,426, with further supports at $23,891 and $22,876, respectively.
Two significant technical indicators provide insights into the current market trend. The Relative Strength Index (RSI) is marked at 37, leaning towards the bearish side.
Meanwhile, the 50-day Exponential Moving Average (EMA) is $27,210. With the current trading price below this EMA value, it underscores a short-term bearish trend in the market.
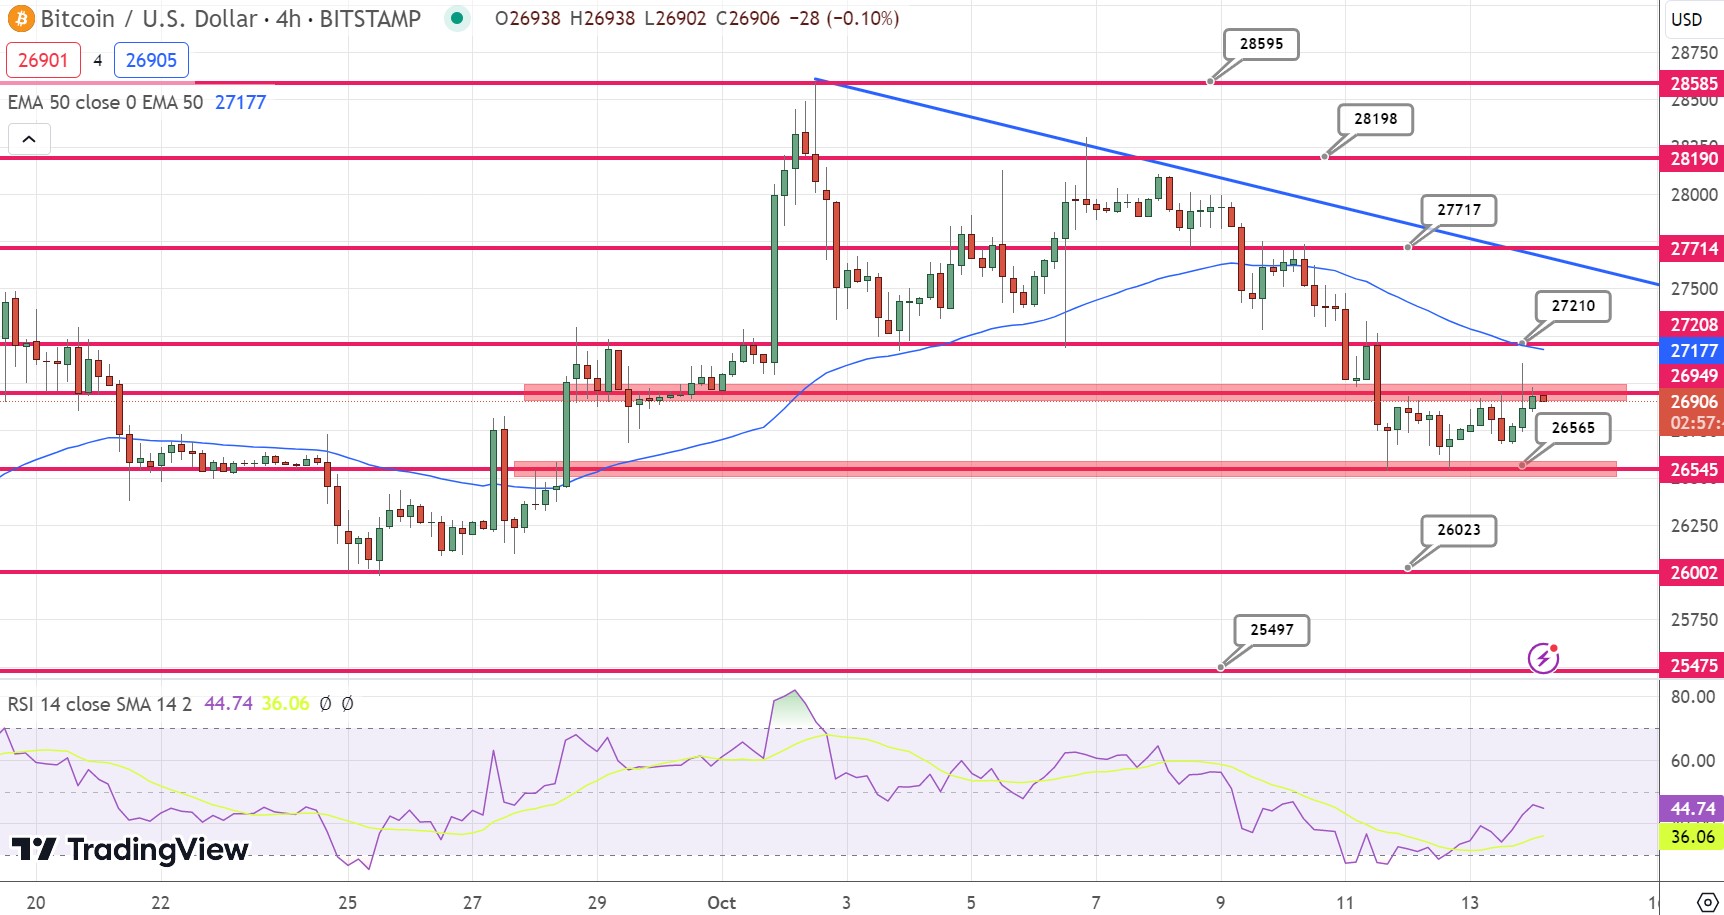
Recent chart analysis has revealed an intriguing pattern: a double bottom breakout at the $26,900 mark. Interestingly, this very level now seems to serve as a resistance for Bitcoin.
Such patterns suggest a testing phase for the digital currency as it grapples with overcoming this resistance.
Conclusively, Bitcoin’s trajectory seems bearish as it remains under the $27,210 mark. However, a breakthrough above this threshold can tilt the trend in favor of the bulls.
Short-term predictions anticipate Bitcoin challenging the aforementioned resistance levels in the forthcoming trading sessions.